Nodejs and V8: Getting Started with Memory and Performance
A recent performance problem on a nodejs app lead me to going into what was actually happening in nodejs. I ended up learning a bunch about how to get insight into nodejs, more specifially v8.
Configuring V8:
A node program can take options in two places, before the script name and after. Adding an argument before the script name will pass the argument to the node proccess. Adding an argument after the script name will pass it to the script.
node --prof index.js --option
This will pass prof to node and v8. “option” will passed to the script.
To get a list of all the V8 options to pass use node --v8-options
V8 and memory.
V8 is the engine that runs javascript code and handles the memory usage. There’s a lot of good information on the web abut Garbage collection and memory in V8 already.
There are two spaces for memory, old space and new space. New space is made of two parts, to and from. Scavenge garbage collection happens in the young space and uses Cheneys algorithm. Mark-sweep runs in old space. Mark-sweep and compacting on old space pause the javascript vm. When v8 can’t allocate any more memory in the young space all objects are moved to the to space. Then the only objects still in use are moved back to the from space. Young space will be cleared of unused objects and compacted. Objects that survive two rounds of scavenge gc are moved to old space. Large objects can be allocated and never go to young space.
If you have the V8 source the garbage collection code is in src/heap/heap.cc. The function CollectGarbage is a decent starting place to follow along with the code for GC.
Node and V8 have a default memory limit of 1.5gb. There are a few options to configure v8 memory. These options would be passed to node. There are more options too.
--min_semi_space_size (min size of a semi-space (in MBytes), the new
space consists of twosemi-spaces)

        type: int  default: 0

  --max_semi_space_size (max size of a semi-space (in MBytes), the new
space consists of twosemi-spaces)

        type: int  default: 0

  --semi_space_growth_factor (factor by which to grow the new space)

        type: int  default: 2

Configure max memory size:

  --max_executable_size (max size of executable memory (in Mbytes))

        type: int  default: 0
Node will also trigger a gc when it gets an idle notification. This can be tweaked through v8 options.
Garbage Collection Options:
GC options:
--trace_gc

--trace_gc_verbose

--trace_gc_nvp
Stolen from the v8 mailing list, an explanation of the gc logs from trace_gc
src/heap/gc-tracer.cc
[29648:0xbad6f48] 2631 ms: Scavenge 8.0 (22.6) -> 4.2 (22.6) MB, 8.4 / 0 ms [allocation failure].
[<process id>:<isolate address>] <absolute time> ms: <type> <start object size (<start memory size>) -> <end object size> (<end memory size>) MB, <scavenge duration> / <time spent in external callbacks, e.g. embedder> [<reason>].
Marksweep example:
[29648:0xbad6f48] 3130 ms: Mark-sweep 8.0 (22.6) -> 4.4 (22.6) MB, 63.0 / 0 ms (+ 69.0 ms in 55 steps since start of marking, biggest step 2.4 ms) [GC interrupt] [GC in old space requested].
Same as the scavenge with the extra
... (<time spent in incremental marking> / <# incremental steps> , biggest step <longest time for incremental marking step>) [<reason, e.g. GC via stack guard] [<ultimate reason>].
Optimizations:
V8 uses hidden classes to keep track of the javascript objects created. Modifying objects after they’ve been created will create a new hidden class. This will allocate more memory for what was one object. As far as v8 is concerned there are 2 now.
When v8 runs code its compiled as quickly as possible. When code is run repeatedly v8 will track this and eventually optimize the function called. Frequently run unoptimized code can cause more memory to be allocated then expected.
var a = 1 +2

var b = 3 +4

var c = a +b
Normally there would probably be 3 variables allocated. unoptimized code by v8 will allocate objects for each operation and integer. You could end up with 12 allocated objects in this example.
Track optimizations with and reasons for deoptimzation. Try catch will cause code to not be optimized along with a few others.
--trace-deopt --trace-opt-verbose
V8 Tools:
In the v8 repo in the directory tools there are some tools to analyze v8 with. Youll need to download the v8 source. There’s alot there and doesnt seem to be very documented. Some of these tools need th v8 javascript shell “d8”. You can use the evironment variable D8_PATH if there are errors about not finding it
Create a v8 timeline with plot-timer-events. This will generate a png file of the state v8 is in
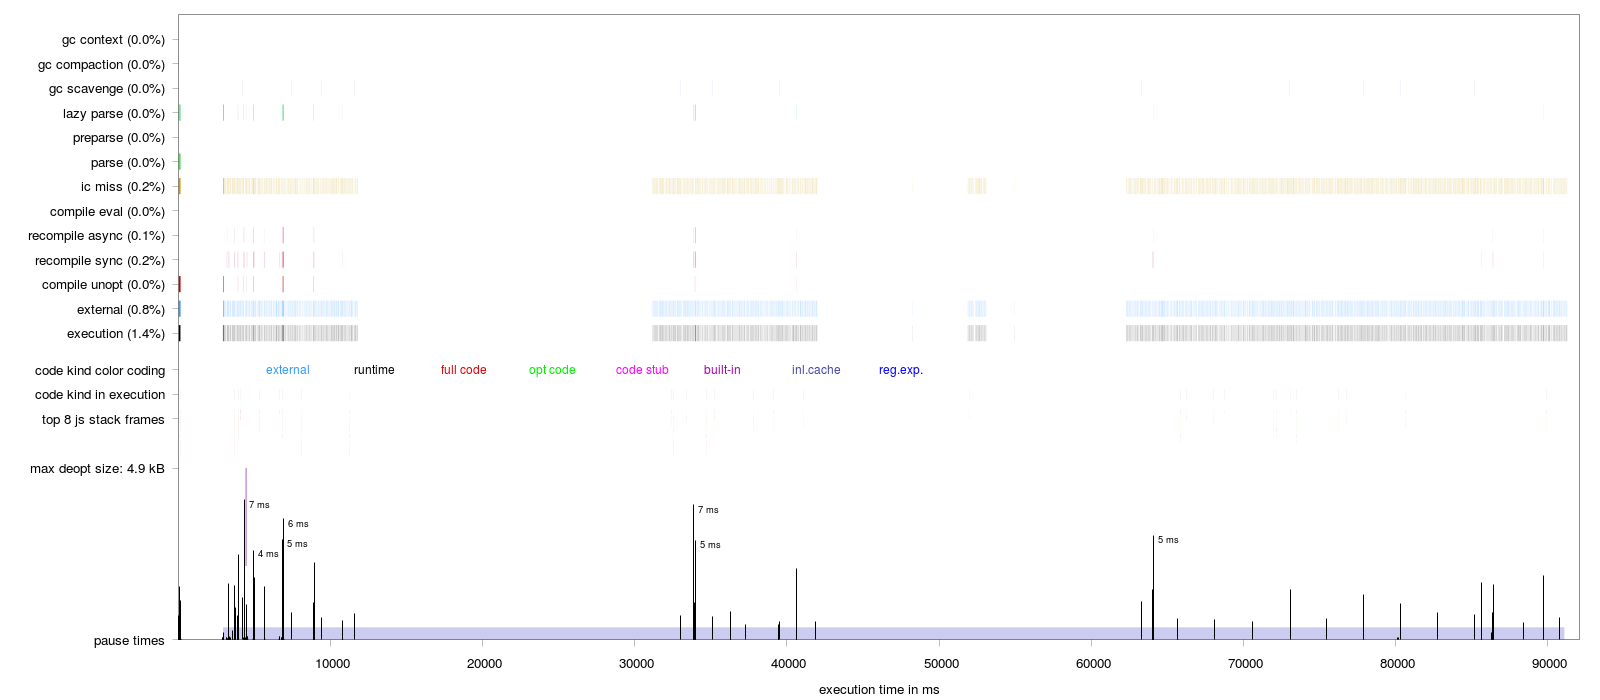
-
run with options
--prof --noprof-lazy --log-timer-events -
Pass the generated log file to the script.
Code kind shows optimized and unoptimized. Green is optimized and blue and red are unoptimized.
Another tools is <os>-tick-proccesor
Functions seen by profiler
“*” shows optimized and “~” unoptimized
–prof –noprof-lazy –log-timer-events
ex:
./tools/linux-tick-processor –range=162000,195000 ./isolate-0x30a5380-v8.log
IC - Inline Cache
There is a tool in v8 to look at ic. I dont know how to make sense of it. But its there.
ic-explorer.html in tools.
Debugging
Compile node to debug with gdb:
clone the node repo.
./configure --debug

make
There is probably a way to compile node to show javascript that is on the stack. I haven’t gotten it to work. Its common to hear that node is single threaded. It’s true that the javascript is single threaded. v8 is actually multithreaded so check the other thread stacks gdb.(Keep this is mind if you use strace too!)
Chrome developer tools can also be used. Its got a bunch of features like memory snapshots and profiling. Newer versions of node have this built in. Your probabaly better off just using that. If not, node-inspector and node-debug can be used to debug. It works by fowaridng a port.
Node-debug doesn’t bind to all address by default. You’ll need to do something like this if your on another machine. Then open the given link the browser. replace localhost with the ip.
node-debug [node/v8 options] --web-host=0.0.0.0
Chrome tools lets you profile the cpu, take heap snap shots.
Add ‘–inspect –debug-brk’ to the node command. Forward the port to
your machine ‘ssh -L 9229:127.0.0.1:9229
Heapsnaphots are also just json so they can be examined pretty easily.
Flamegraph profiling:
Theres a lot of tools to do this. I thought perf is pretty cool. http://www.brendangregg.com/blog/2014-09-17/node-flame-graphs-on-linux.html
Extra Reading and sources:
Extra reading on v8 and javascript vms. I found it helpful to think of node less of a node application and more of v8 application.
- https://www.youtube.com/watch?v=VhpdsjBUS3g&feature=youtu.be&t=16m30s
- https://www.future-processing.pl/blog/a-curious-case-of-memory-leak-in-a-node-js-app/
- http://mrale.ph/blog/2011/12/18/v8-optimization-checklist.html
- https://groups.google.com/forum/#!topic/v8-users/OIICvStFMmc
- https://groups.google.com/forum/#!searchin/v8-users/gdb%7Csort:relevance/v8-users/GxCmg3fRaLU/p6Jb95RkQ9cJ
- V8 Inside Out” from WebRebels 2012